Knowledge
Centre
Carbon Action – Comparative GHG Study Summary Report
Comparing emissions from onsite non-thermal treatment of Biohazardous waste to traditional treatment methods
Reporting Scope:
Carbon Action, an independent Carbon Consultancy firm based in London, England was asked to quantify the life cycle Greenhouse Gas (GHG) emissions created in the processing of biohazardous waste from a number of Life science facilities based in Ireland, The U.K. and The U.S. – comparing the current approach with an onsite disinfection and shredding technology. Throughout these reports the alternative approaches were referred as Channel A and Channel B respectively. These comparisons included the complete life cycle emissions of the two processing chains. The emissions in the processing chain are owned by different entities: however, the totality of emissions can be influenced by decisions made by the Life Science facility (and/or its Managed Service Provider).
By quantifying the life cycle emissions of alternative waste management approaches, Carbon Action proposed that we can predict how much environmental improvement can be made. Essentially asking “if the waste was not processed in the current way – could we reduce the amount of CO2e released into the atmosphere?”
Each processing chain starts after the waste has been created. Each processing chain ends when the waste is rendered disinfected and suitable for and brought to, the point of recycling or final disposal. To establish a benchmark, Carbon Action used the amount of biohazardous waste produced for calendar 2022 at each facility.
The objective of these reports was to quantify all emissions generated in processing the biohazardous waste/regulated medical waste streams these facility produce, through the alternative processing chains. The analysis used 2022 data as a representative, full year baseline.
Reporting Standard:
GHG emissions quantification has been calculated in conformance with ISO 14064-1: Specification with guidance at the organization level for quantification and reporting of greenhouse gas emissions and removals. The standard is built on the principles of Transparency, Relevance, Accuracy, Consistency, Completeness, and Conservativeness.
Confidentiality:
Carbon Action assures the confidentiality of all information provided to us during the course of this process as well as documents (if any) provided by the client. No information on the company will be communicated to any third party.
Independence:
Prior to entering into a contract to conduct GHG assignments, Carbon Action undertake a review of potential conflict of interests and threats to impartiality which may arise, and the organisation only enter into engagements where the organisation’s impartiality is not impaired. During the course of the engagement, Carbon Action continue to monitor to their impartiality to ensure services comply with the requirements of both the ISO 14064-1 and ISO 14064-3 standards and the GHG Protocol. Carbon Action confirmed that throughout each report they were not aware of any potential conflicts of interest that would prevent from providing independent assurances to Client Company.
Channel “A” Treatment Example:
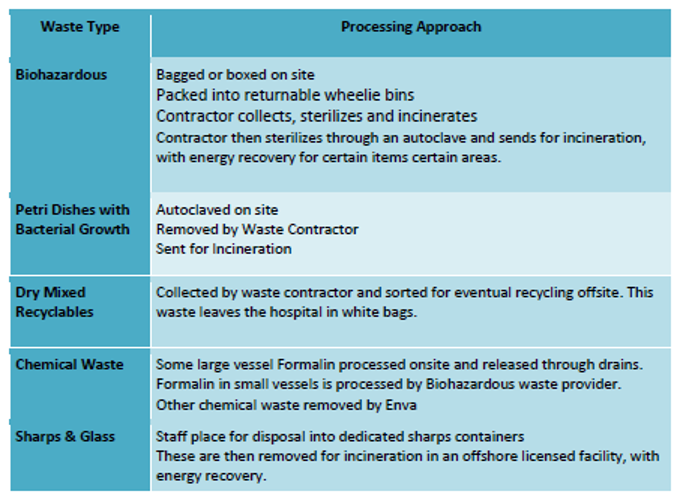
In these reports, Carbon Action would first asses the current operations of a life science facility to understand it’s operation and the source of their waste streams. The below is an example from one of the reports carried out at a hospital diagnostics lab in Ireland.
The hospital served as the largest and anchor hospital of a Hospital Group. The Group was comprised of six regional healthcare facilities in Ireland, which acted collectively as a clinically integrated healthcare system. Within this network, the Hospital itself was also a clinically integrated, research-driven healthcare provider, operating a full-service acute hospital that included in-house laboratory support.
The Hospital served the analytical needs of all Group hospitals, those of a further two in the area, and also those of the general practitioners in the region. In all, five separate labs operated on the campus in Blood Sciences, Histology, Blood Bank, Serology, and Microbiology. The laboratories represented a full-service offering, conducting a variety of tests on bloods, urines, tissue, respiratory sputum, swabs, and more. Testing time varied and as in the case of certain blood bank testing, could last as long as five days.
The labs retained samples post-testing for various amounts of time, depending on the test and patient category: this created a need for substantial storage capacity at the hospital. The Hospital staff were very disciplined and consistent in their use of the appropriate disposal containers for different categories of waste, thereby preventing cross-contamination of waste streams. The possible exception to that was where non-biohazardous items were placed into hazardous receptacles.
This happened routinely, due to both a lack of space to allow separate containers and out of caution to avoid cross-contamination.
The approach to processing this waste was as follows:

Quantifying Channel A vs Channel B:
Once the treatment methods were assessed the studies would quantify the emissions associated with each approach or “channel”. Beyond a facilities traditional biohazardous waste management processes this also took into account variables such as volume of waste produced and distance to key treatment sites. Below is an example of this process for a healthcare facility:
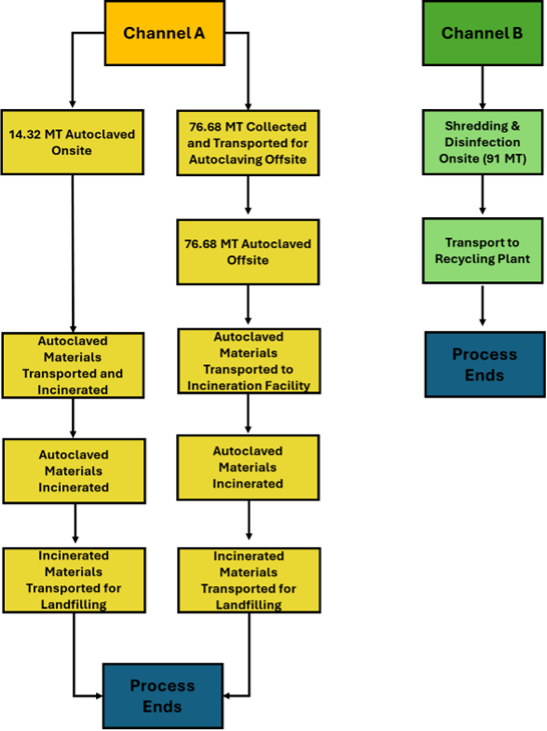
In order to compare both processes, Carbon Action first outlined the steps in Channel A and then where the new technology would fit in if implemented. Channel A followed a process of waste generated and collected onsite which went through two different sub-processes. A small portion of the hazardous waste was processed onsite using the autoclave machine. The autoclaved hazardous waste was then collected and transported to an incineration facility for treatment and sequentially then transported for landfilling. The majority of the hazardous waste was collected by a waste management company from a facility in loaded bins which then were transferred to their facility for autoclaving. This waste was then transported to the same incineration facility for treatment and sequentially transported for landfilling.
If the new technology, placed at this site to process the same waste, would follow a different process. The total amount of waste could be processed onsite and offsite autoclaving, incineration, and landfilling were not necessary. When hazardous waste was collected onsite, the new technology could process this waste and the remaining recyclable polymer flake could then be collected and transported to the designated recycling plant for use.
Impacts were assessed on a life cycle basis for each, where the life cycle boundaries were set out below. The parameters assessed included the greenhouse gas (GHG) emissions generated within the life cycle boundaries, upstream emissions avoidances, water consumption, and broad, general environmental side effects.

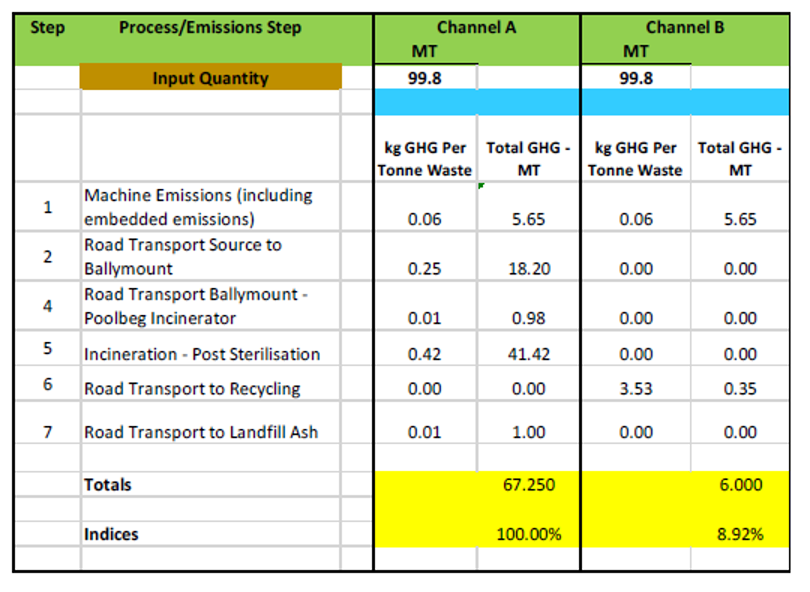
Chain emissions are the sum of the emissions from the steps involved. These are tabulated below for both the Channel A and B processing chains.
The emissions footprint of the hospital’s biohazardous waste through Channel A is 67.25 MT CO2e per annum, based on the waste in 2022 of 99.8 Mt. Processing that same waste onsite using Channel B, would reduce the chain wide emissions to 6 Mt. The step change is achieved by effecting disinfection without autoclaving, incineration, and by avoiding Chain emissions are the sum of the emissions from the steps involved. These are tabulated below for both the Channel A and B processing chains.

The emissions footprint of the hospital’s biohazardous waste through Channel A is 67.25 MT CO2e per annum, based on the waste in 2022 of 99.8 Mt. Processing that same waste onsite using Channel B, would reduce the chain wide emissions to 6 Mt. The step change is achieved by effecting disinfection without autoclaving, incineration, and by avoiding the circuitous logistics of transporting the waste from the hospital through multiple stages.
The same approach was followed for each report with bespoke considerations based on the potential variations mentioned above. From all reports carried out from July 2022 – May 2024 it was found the installation of non-thermal, onsite treatment technology could reduce emissions by 90% on average.
Additional Findings
While analysing the emissions profiles of two these two alternative processing chains an number of additional trends were noted that could be considered additional benefits that are created by deploying onsite disinfection and shredding. These benefits fell beyond the scope of these reports but were noted by the authors. These benefits included:
- Space creation: Onsite shredding and disinfection creates an average volume reduction of the order of magnitude of 90%. Moreover, Waste can go for immediate processing, rather than have to be stored awaiting collection by an external waste contractor. Also, the provider supplied wheelie bins are bulky and are currently stored in the underground park, given the lack of sufficient space. This removes parking space and creates additional handling for onsite staff.
- Avoidance of cost penalties: through lack of space in the labs (and given the fragmentation/separation of the five labs, due to cross contamination and differential processing requirements – space is tight. This can mean there simply is not room for separated waste containers for hazardous and non-hazardous materials. That in turn means that non- hazardous materials end up with the hazardous. The non-hazardous then undergoes the same multistage processing. Onsite processing would remove this problem immediately.
- Energy Efficiency: as the Channel B technology uses chemicals without requiring heat, it is a smaller drain on the power grid and reduces energy bills. The waste generator does not see the itemised cost for this – but the collective interest would be served by reducing the burden on scarce natural gas supplies.
- Wider Environmental Impact: The air pollution associated with transportation journeys and incineration would be greatly reduced with onsite disinfection and shredding.
- Avoidance of Transport of Dangerous Goods: of the 50 truck currently required – 25 of these would fall in scope for ADR – “Accord Européen relatif au transport international des marchandises dangereuses par route”, which translates as “The European Agreement concerning the International Carriage of Dangerous Goods by Road.” ADR requirements are onerous, including the need for information on handling and shipments of all dangerous goods to be catalogued in annual reports by a qualified DGSA. Most countries in the world are signatories to the ADR, so this particular benefit is near universal.
- Enhanced recycling and circularity: at present, there is no circularity: infected product gets burned and the ash is landfilled. If the product is processed by Channel B, it can be easily recycled. Because it is also good quality feedstock for recyclers – it does get recycled. Because some of the stock is high value and creates tax breaks – it will get recycled.
- Reduced landfilling: Landfilling is a finite resource. In many jurisdictions it is subject to increasing restrictions or even banned altogether. If that happens, waste will need to be shipped offshore, which will significantly shift the processing footprint – in a negative way. Again, it is better to preclude these risks through a designed, disruptive solution.
Additional Information:
If you’re interested in reviewing a full, industry version of Carbon Action’s reporting you can request one using the link below.